
Your company's data on one screen. No more parallel spreadsheets.
Rowan Tech's business intelligence product: 11 sector dashboard templates already built, connected to your ERP or database. Sales, margins, stock turnover, receivables and each sector's own KPIs — live, in real time.
A base product with sector templates already built. Each implementation is adjusted to the data source and the client's real formulas.
The process, step by step

Turn your data into clear decisions
Analyze patterns, monitor performance and uncover actionable insights to decide faster and with more confidence.
Sector-specific dashboards, not generic templates
Direct connection to your ERP, database, GA4 and Search Console
Revenue, margin and inventory KPIs
Live in under 48 hours
The BI tool that understands your sector before it even connects.
BI tools like Power BI or Tableau are powerful but arrive empty: you buy the licence, someone spends weeks defining metrics, and most of the time the dashboard that gets published is a PDF full of pretty charts nobody looks at. Rowan Analytics ships with dashboards already thought through by sector, covering the KPIs any company of that type checks at the end of the month.
In practice, on day one you have sales, margins, debt and stock turnover. From there we adjust the formulas to how your company actually calculates them and activate the sector-specific dashboards. The public demo with synthetic data shows all 11 sectors already built.
Dashboards ready on day one.
Built from real implementations across 11 sectors. If yours is covered, what you're about to ask for has already been thought through.
Sales and margins
Revenue by customer, product and salesperson. Real margin after deducting rebates and logistics costs. YoY and MoM comparisons.
Warehouse turnover
Dead stock, days of coverage, products with no movement for over X days, capital tied up by product family.
Receivables ledger
Real debt by customer, ageing, overdue payments, incident ratio and cash-flow forecast at 30/60/90 days.
Purchasing and suppliers
Purchases by supplier, real vs agreed average lead times, dependency on each supplier and price deviation.
Daily operations (sector-specific)
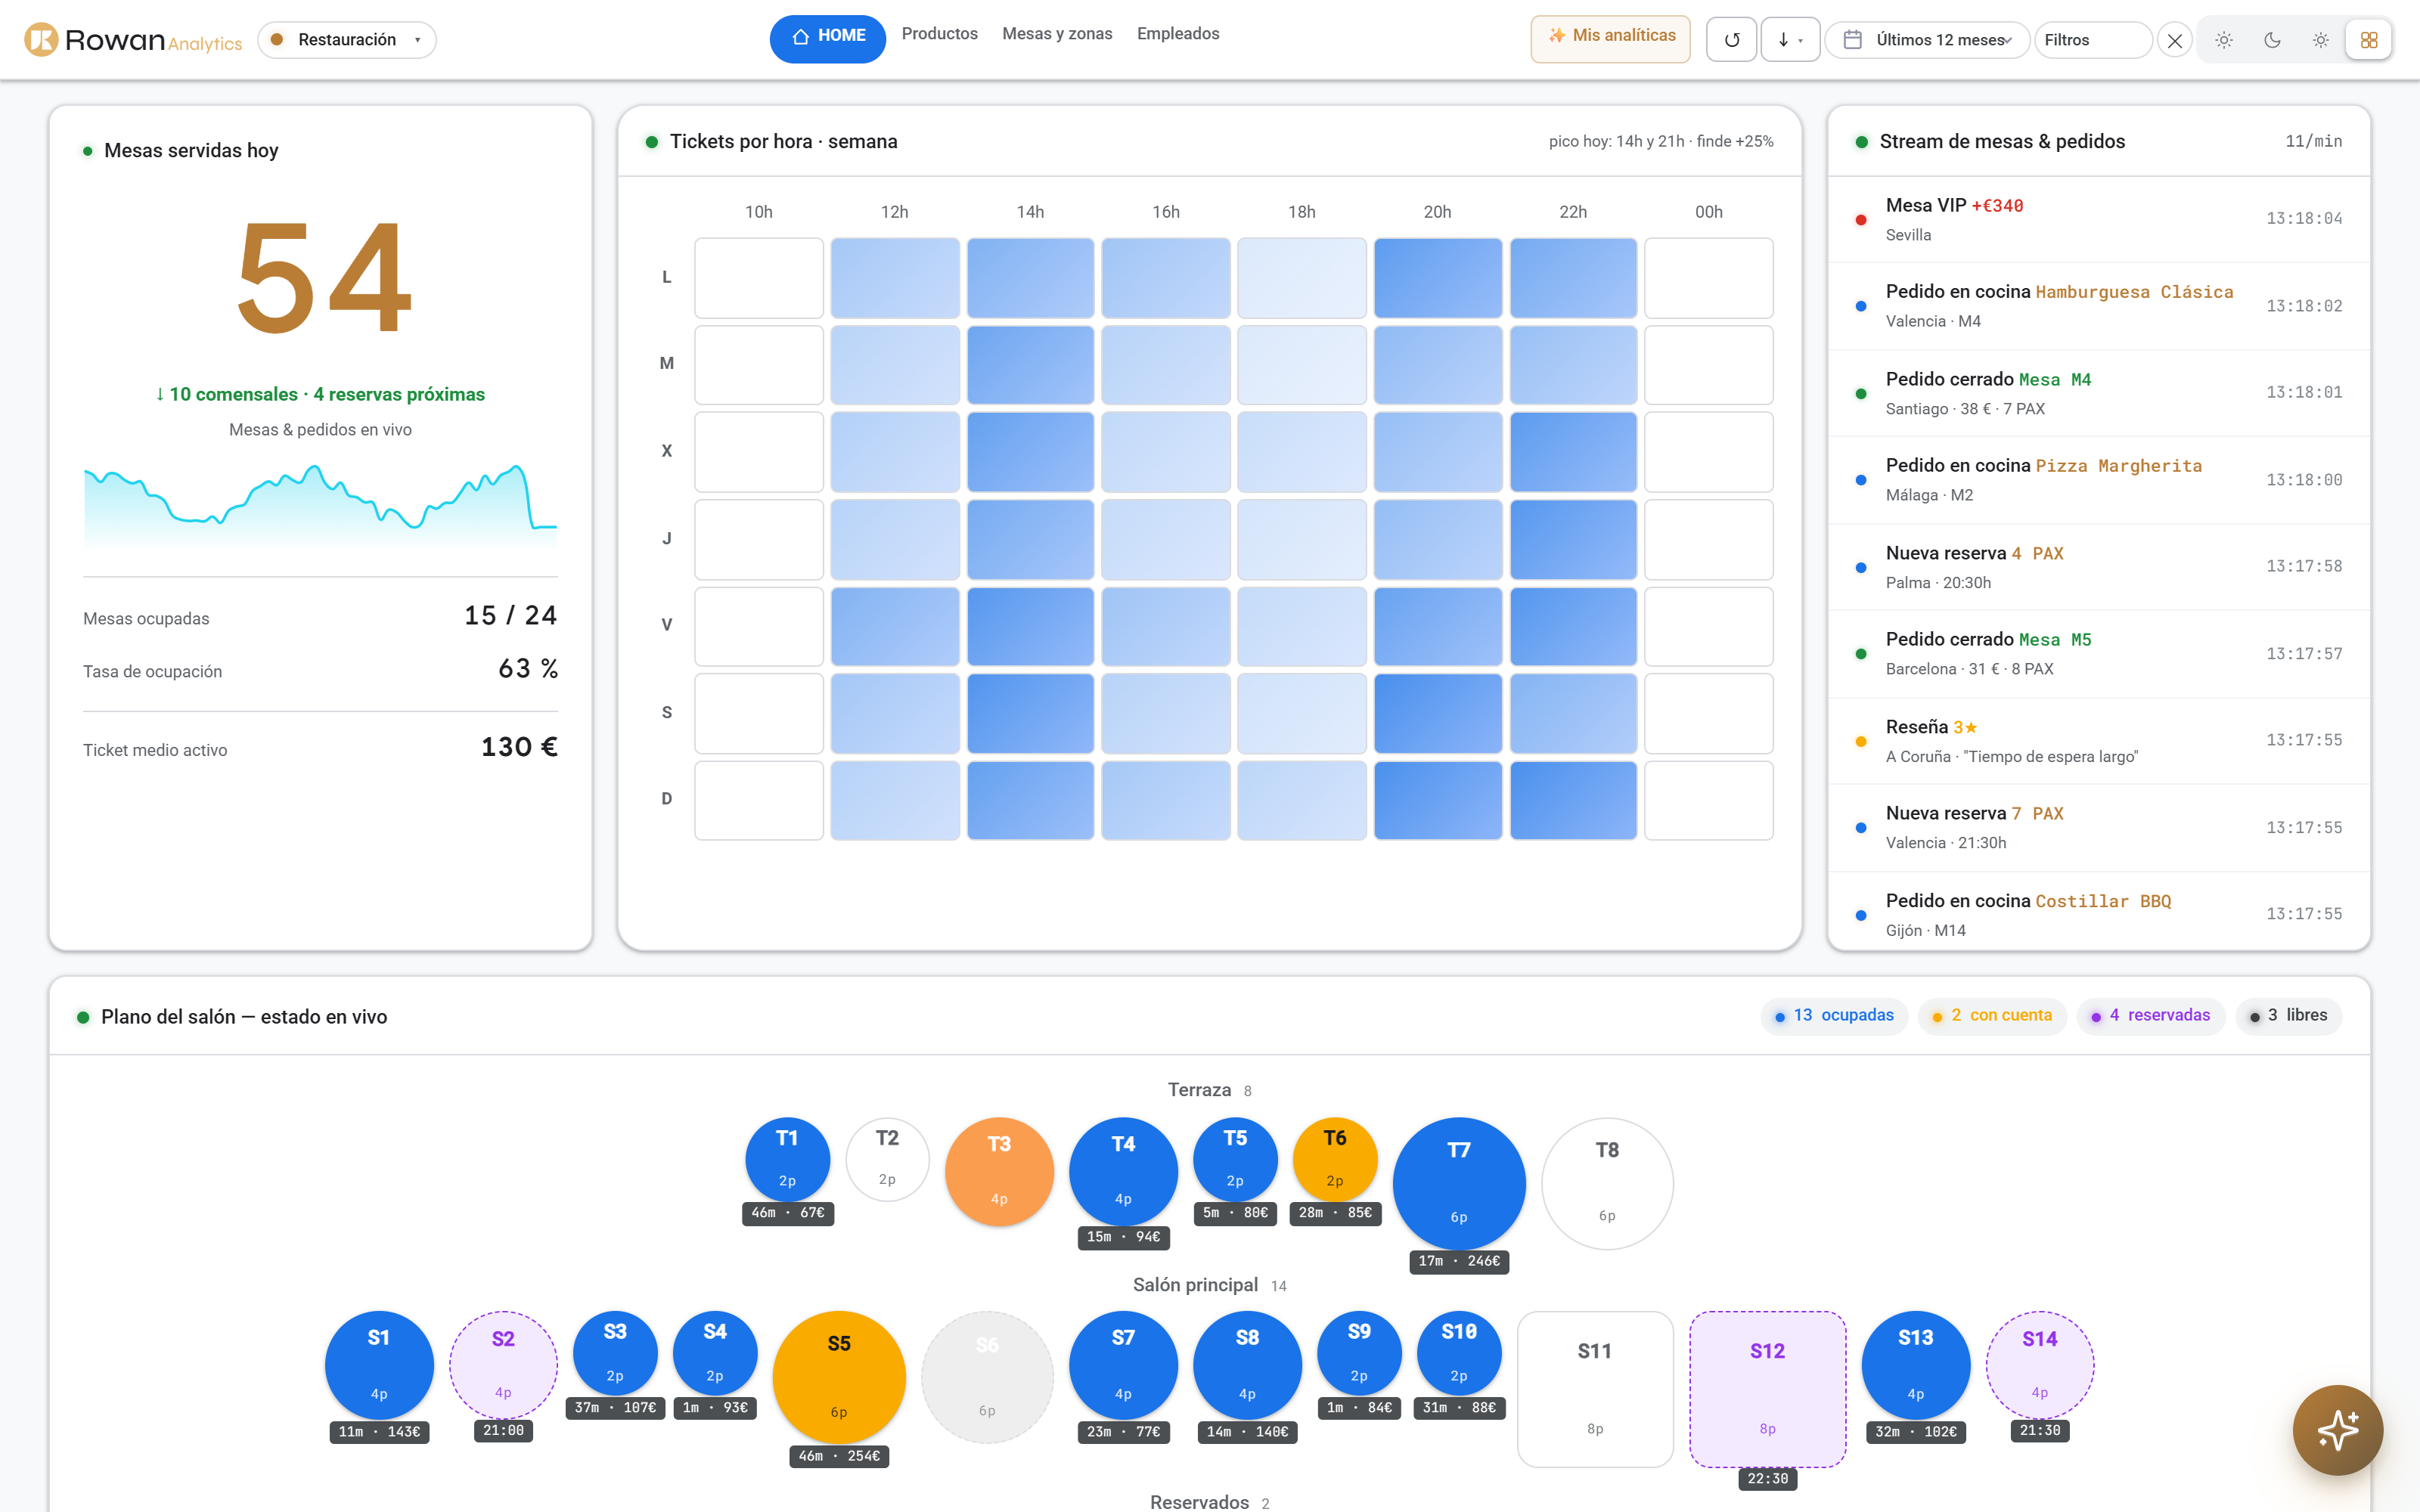
Specific to each sector: occupancy and RevPAR for hotels, average ticket for restaurants, OEE for industry, certifications for construction sites, appointment-book occupancy for clinics, etc.
Executive dashboard
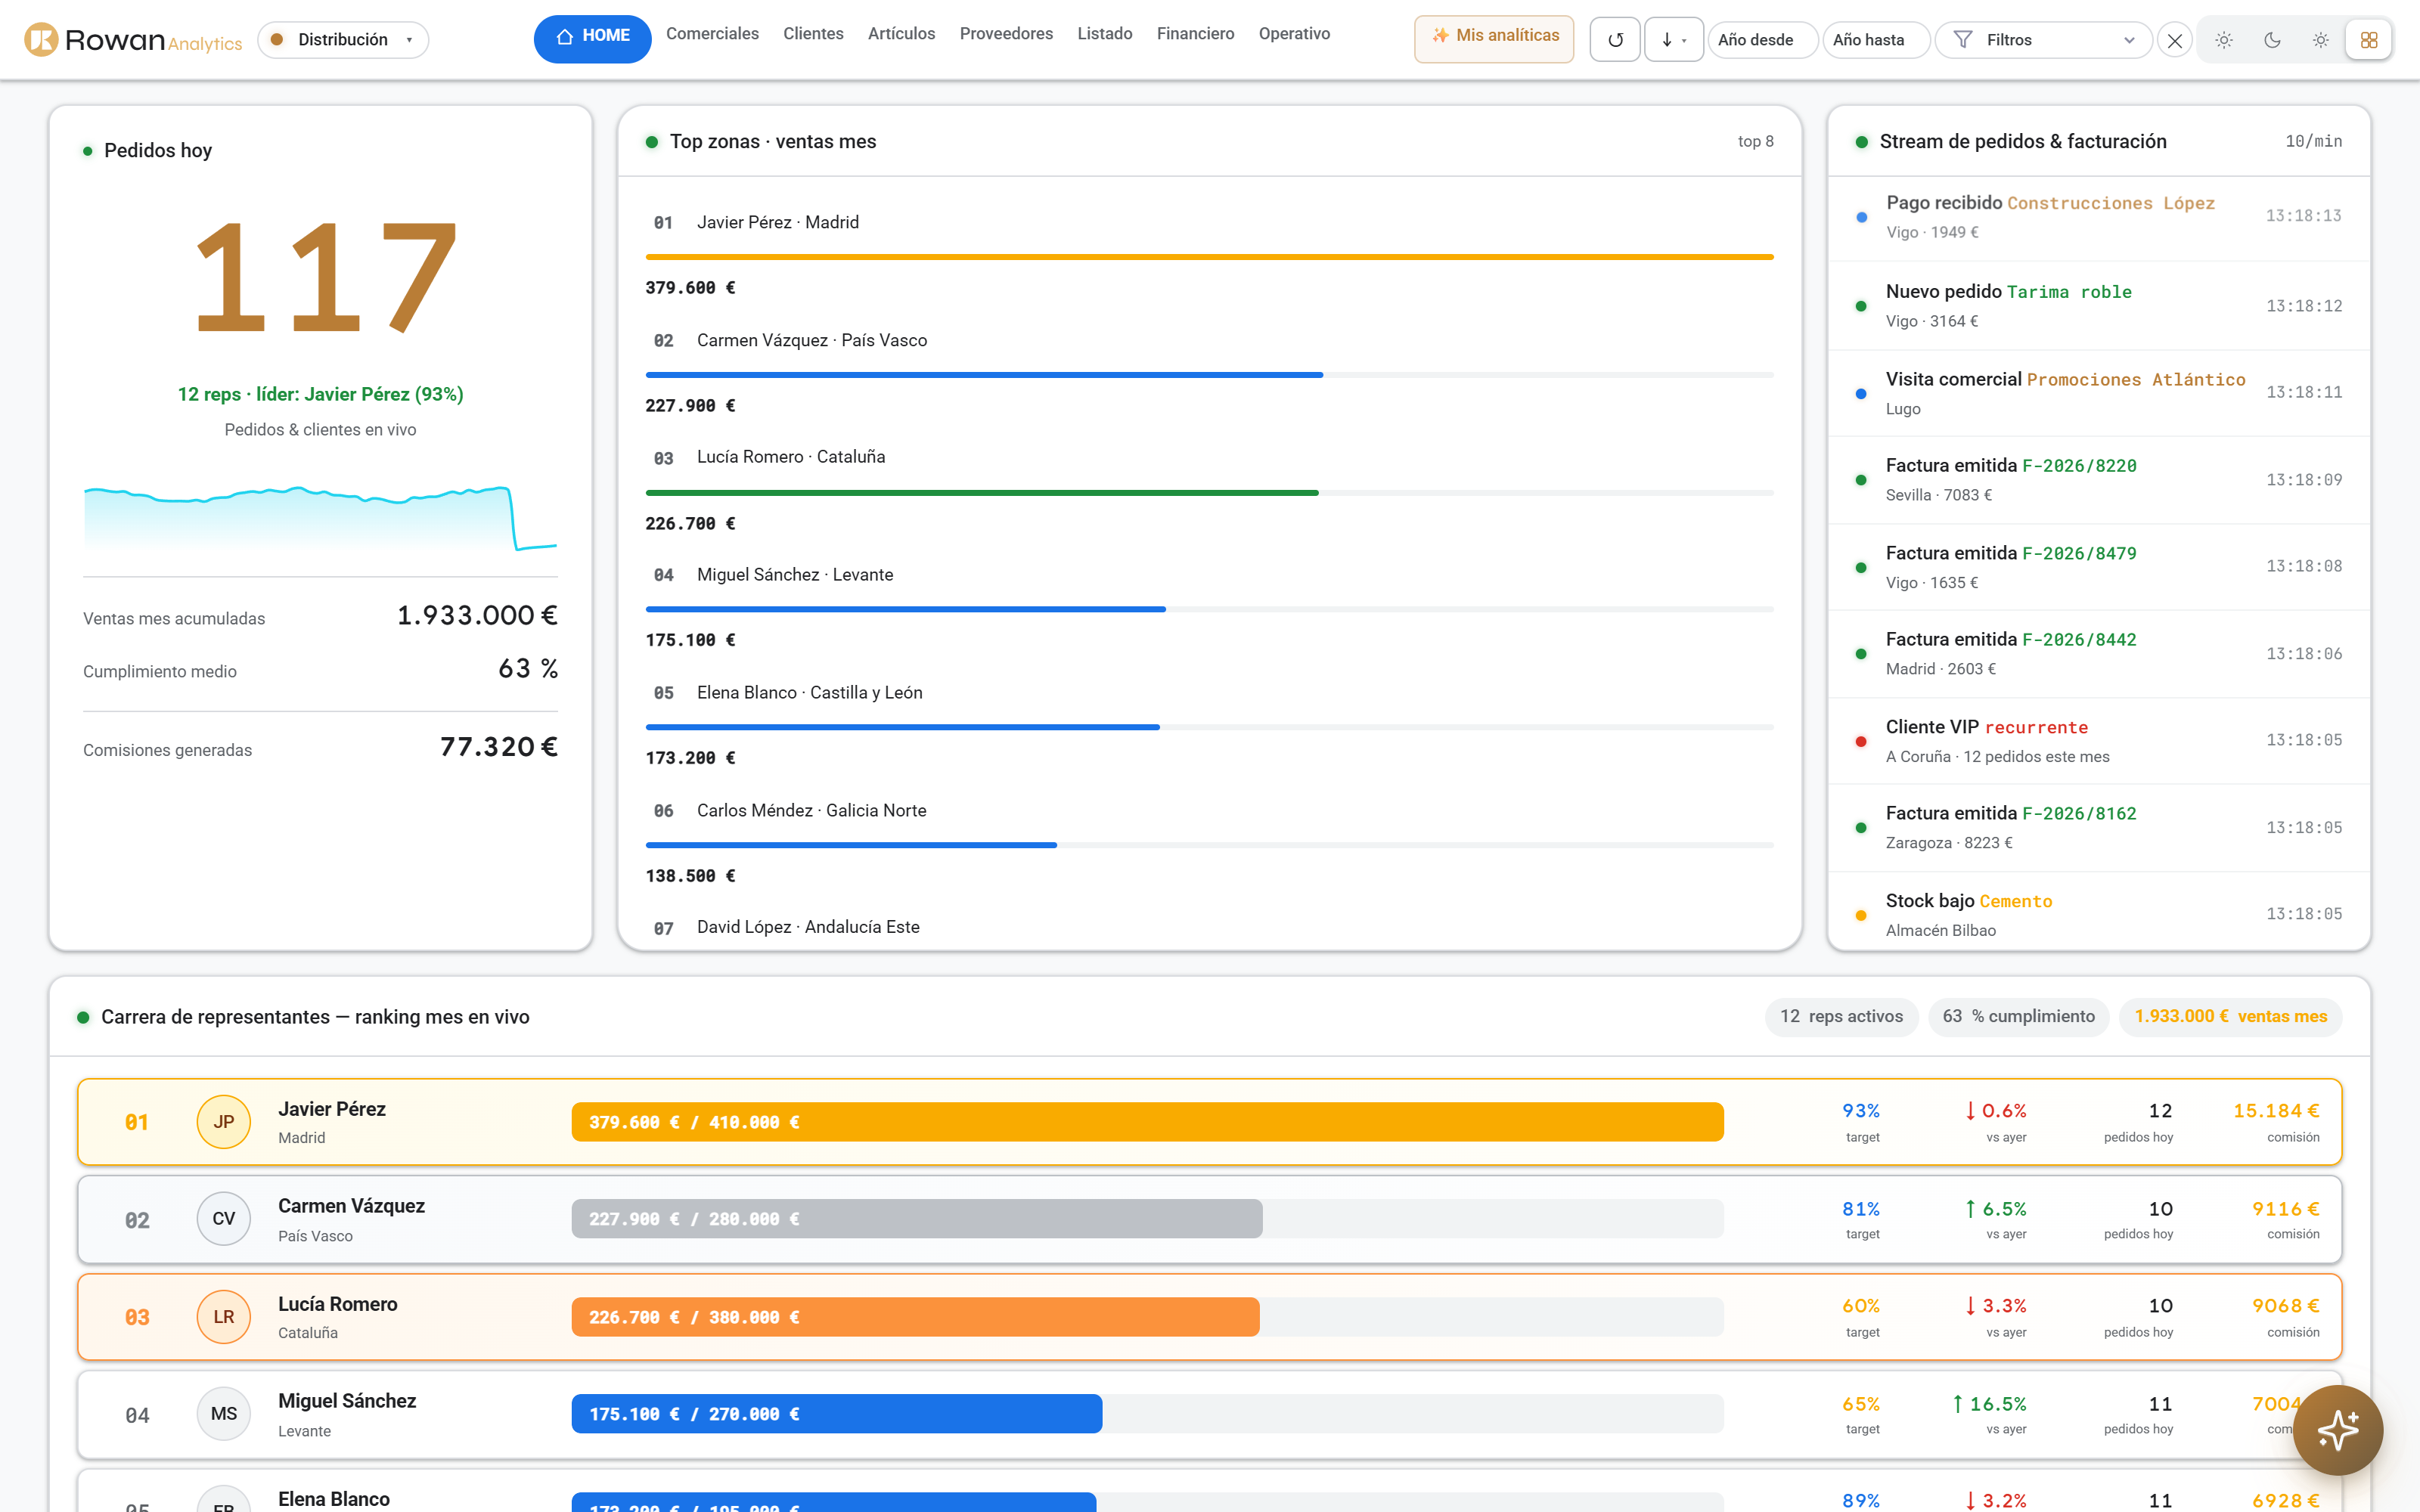
One screen with the 8-10 indicators management looks at every morning. A summary, not a report.
11 sector templates in production.
Each template starts from the KPIs any company in that sector checks at month-end close. All of them are navigable with synthetic data in the public demo.
Distribution
Turnover, margins by family, debt by customer.
Hotels
Occupancy, ADR, RevPAR, booking channel.
Construction
Margins by project, certifications, deviations vs budget.
Industry
OEE, downtime, waste and cost per production order.
Restaurants
Average ticket, food costing, table turnover, food cost.
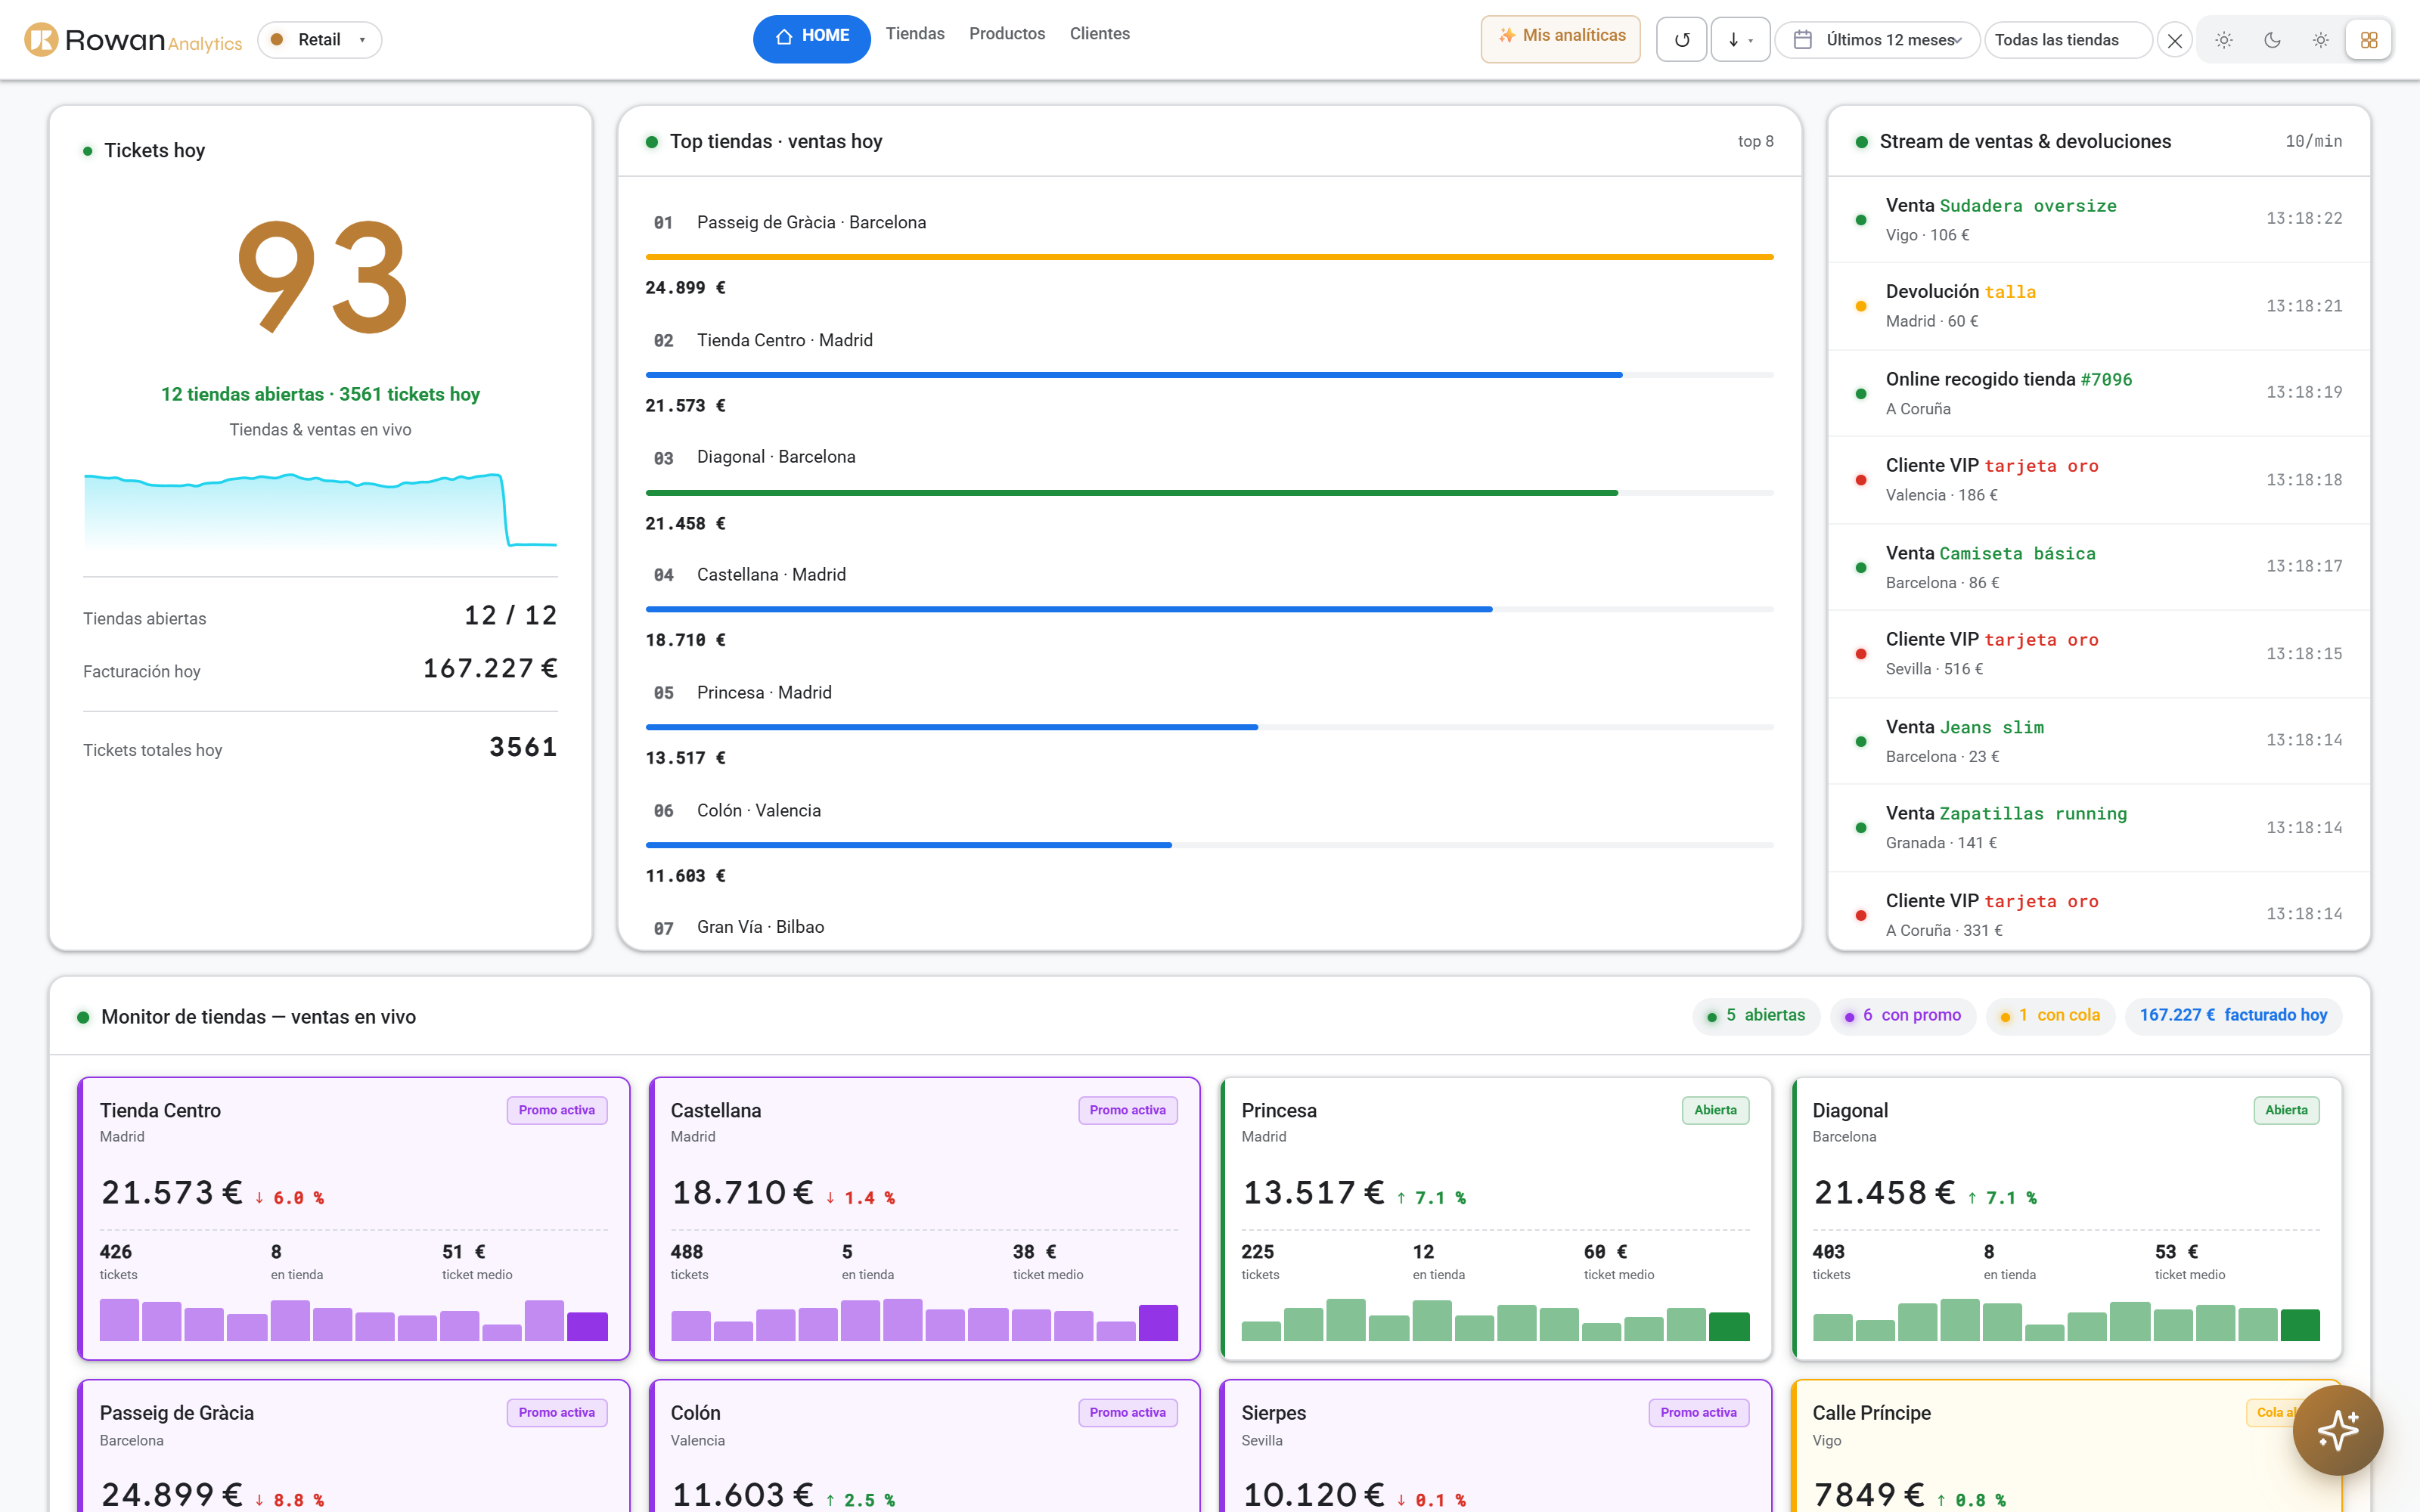
Retail
Sales per m², average ticket, conversion and SKU turnover.
Clinics
Appointment-book occupancy, no-shows, revenue by specialty.
Logistics
Km and €/km per vehicle, fleet occupancy, lead times.
Real estate
Live portfolio, days on market, listings won, exclusivity ratio.
Mechanical workshops
Revenue per repair order, productive time.
Fishing / fish market
Average price per kilo, catch per vessel, waste.
Isn't your sector here? We start from the base KPI block (sales, margins, turnover, receivables) and build the specific dashboards during implementation.
The numbers you check every morning, on one screen.
Live KPIs connected to your ERP, revenue trends and top categories. Dashboards already thought through for your sector, not a blank canvas.
The templates are the starting point. Your dashboards are yours.
"Margin" means different things in different companies. Some deduct rebates before, others after. Some allocate logistics to the product, others to the customer. The sector template covers the base, but the real formulas are closed with you in session and documented so that in six months' time the dashboard still calculates the same thing as the P&L.
Way of working: first technical meeting with whoever knows the figures, fixed proposal, phased implementation with KPI validation against the accounting data you already know.
Connection to your ERP or database
Direct read access to Sage, Holded, Odoo, your own database or any system with a REST API.
KPIs defined with you
Initial session with whoever knows the real business figures, to set the formulas. No theoretical metrics nobody looks at.
Sector-specific dashboards
There are 11 starting sector templates. Each implementation starts from the closest one to your business and is adjusted from there; if your sector doesn't match any, we work from the base KPIs.
Role-based permissions
Sales sees their area, managers see the whole network, accounting sees receivables. Configurable down to row level.
Your own brand and domain
Dashboards under dashboard.yourcompany.com with your logo and corporate palette, not under a Rowan subdomain.
11 sectors built. The language your team already speaks.
The public demo at analiticas.rowan.gal runs on synthetic data and lets you browse all 11 sectors freely. It's not a mock-up: they're the same screens, the same formulas and the same breakdowns delivered in a real implementation, so it's a way to check, before asking for anything, that the vocabulary and the KPIs match how your team already looks at the business every month.
Each implementation starts with a technical session to set the exact formulas with whoever knows the real figures (rebates before or after, logistics allocated to the product or the customer, what counts as effective margin), continues with the connection to your ERP or database, and ends with validating the KPIs against the accounting data you already know. We prioritise companies that already have an ERP or centralised database and a finance or operations contact available during that phase.
They usually go together.
What people ask us before getting started.
Is this a standard BI tool like Power BI, or something different?
It's different in philosophy. Power BI, Looker or Tableau are generic tools: you buy the licence and spend weeks building dashboards from scratch. Rowan Analytics arrives with dashboards already thought through for 11 specific sectors (distribution, hospitality, construction, industry, restaurants, retail, clinics, logistics, real estate, workshops and fish markets) and connects directly to your database or ERP. What we customise is the connection and the KPIs your team looks at every morning, not the whole engine.
Where does it get the data from? Do I have to change my ERP?
You don't have to change anything. Rowan Analytics connects to the database you already use (Sage, Holded, Odoo, your own database or Google Sheets) in read-only mode. It doesn't write to the ERP, doesn't break anything and doesn't require migrating systems. If your source is a spreadsheet updated by hand, that also works as a starting point.
How long until I see the first dashboards working with my data?
Between 2 and 6 weeks depending on the complexity of the data source. The first week is for accessing the database and understanding the model. The second and third are for building the base KPIs (sales, margins, stock turnover, debt, costs) and validating them against the figures you already know. From the fourth week on, we start adding sector-specific dashboards.
Which sectors do you already cover?
11 sectors with starting dashboards already built: distribution, hotels, construction, industry, restaurants, retail, clinics, logistics, real estate, mechanical workshops and fishing/fish markets. All navigable with synthetic data in the public demo (analiticas.rowan.gal). If your sector isn't on the list, we start from the base KPIs (sales, margins, debt, stock turnover) and develop the specific dashboards during implementation.
Who has access to the data? Is it hosted in Spain?
Data is processed on our own infrastructure hosted in Spain. Each client has their own isolated environment with per-user authentication and role-based permissions (a salesperson doesn't see margins, a manager does). If your company has specific compliance policies (advanced GDPR, healthcare sector, AEPD), we assess the implementation against those requirements before starting.
Does it replace a spreadsheet or an in-house BI team?
It replaces the parallel spreadsheet that someone updates every Monday and nobody's sure is the latest version. It doesn't replace a BI team when the company already has a mature data warehouse and needs complex dimensional modelling. For that case, the honest answer is custom development on dbt or similar; we'll tell you so in the first meeting.
If your dashboard lives in a spreadsheet someone updates on Mondays, this is for you.
First meeting: we show you the demo, look at your data source and decide together whether it makes sense to start. No forced proposal.
Compliance and security
Compliant with Spanish and European regulations.
Our software meets the current legal requirements for invoicing, electronic signature and data protection. Information security isn't an extra — it comes standard.

Verifiable invoicing · AEAT
GDPR · Data protection · EU 2016/679
We apply information security best practices inspired by ISO/IEC 27001 and the Spanish National Security Framework (ENS).